An interesting feature in SocExplorer is that you can drag and drop a python script in the terminal, it will execute it. First you can get some updated examples in the doc folder of SocExplorer source code.
The key object to load plugins is the proxy object, in SocExplorer console you can type proxy and then with the "tab" key you will get all the available methods. The ones you need are loadSysDriver() and loadSysDriverToParent(), you can get their definition by invoking them without any arguments. In most cases with SocExplorer if you don't know how to use a python method just call it and you will get its definition.
#to load the AHBUART plugin
proxy.loadSysDriver("AHBUARTplugin")
# You can also specify an instance name
proxy.loadSysDriver("AHBUARTplugin","InstanceName")
# SocExplorer can also resolve the plugin from it file name
proxy.loadSysDriver("/home/your-path/.SocExplorer/plugins/libahbuartplugin.so")
# Even without the path
proxy.loadSysDriver("libahbuartplugin.so")
A child plugin need a parent to be connected to.
#to load the GenericRWplugin plugin and connect it to AHBUARTplugin0 instance
proxy.loadSysDriverToParent("GenericRWplugin", "AHBUARTplugin0")
# You can also specify an instance name for the child plugin
proxy.loadSysDriverToParent("GenericRWplugin","InstanceName", "AHBUARTplugin0")
#As for root plugin SocExplorer can resolve the plugin from it file name.
All the plugins will provide you two methods to read or write, with root plugin it means read or write in the SOC bus. With child driver it can have different meaning depending on the plugin. Usually to read or write on your SOC just do:
#rootplugin is your root plugin instance name, address is the address from where you want to read.
#count is the number of words you want to read /!\ usually it is 32 bits words.
#If count=2 you will read two 32 bits words.
data=rootplugin.Read(address, count)

#If you want to write just do
rootplugin.Write(address, [Word1,Word2,...])
Since revision r71 of SocExplorer all plugins offer you some memory dump or load functions. You can easily load an elf, srec or binary file directly in the soc memory or dump any memory space in a binary or srec file.
#rootplugin is your root plugin instance name, address is the address from where you want to read.
#count is the number of words you want to read /!\ usually it is 32 bits words.
#If count=2 you will read two 32 bits words.
#file is the source or destination file name "/yourpath/yourfilename"
#format is the file format 'srec','binary'
data=rootplugin.Read(address, count)
rootplugin.dumpMemory(address, count, file, format)

#If you want to load a file
#file is an abstractBinFile, you need to create one before

#for an elf file
file = PySocExplorer.ElfFile("/yourpath/yourfilename")

#for an srec file
file = PySocExplorer.srecFile("/yourpath/yourfilename")

#for a binary file
file = PySocExplorer.binaryFile("/yourpath/yourfilename")

rootplugin.loadfile(file)
With SOC design on FPGA, you can easily change the number of peripherals or their base address but you don't necessary want to update your python script each time you modify your SOC layout. One solution is to use plug and play feature such as the one provided by the Gaisler's GRLIB. SocExplorer is able to store and distribute the list of peripherals and their address, once a dedicated plugin did the scan for him such as the AMBA plugin. We suppose that the connection to the SOC is active, the scan is done and the root plugin instance name is "RootPlugin".
#this function will return the base address of the first matching VID/PID device in the list
#by convention it is also the lower address one
baseAddress = SocExplorerEngine.getEnumDeviceBaseAddress("RootPlugin",VID,PID)

#you an also specify the index of the device, if you want the second
baseAddress = SocExplorerEngine.getEnumDeviceBaseAddress("RootPlugin",VID,PID,1)
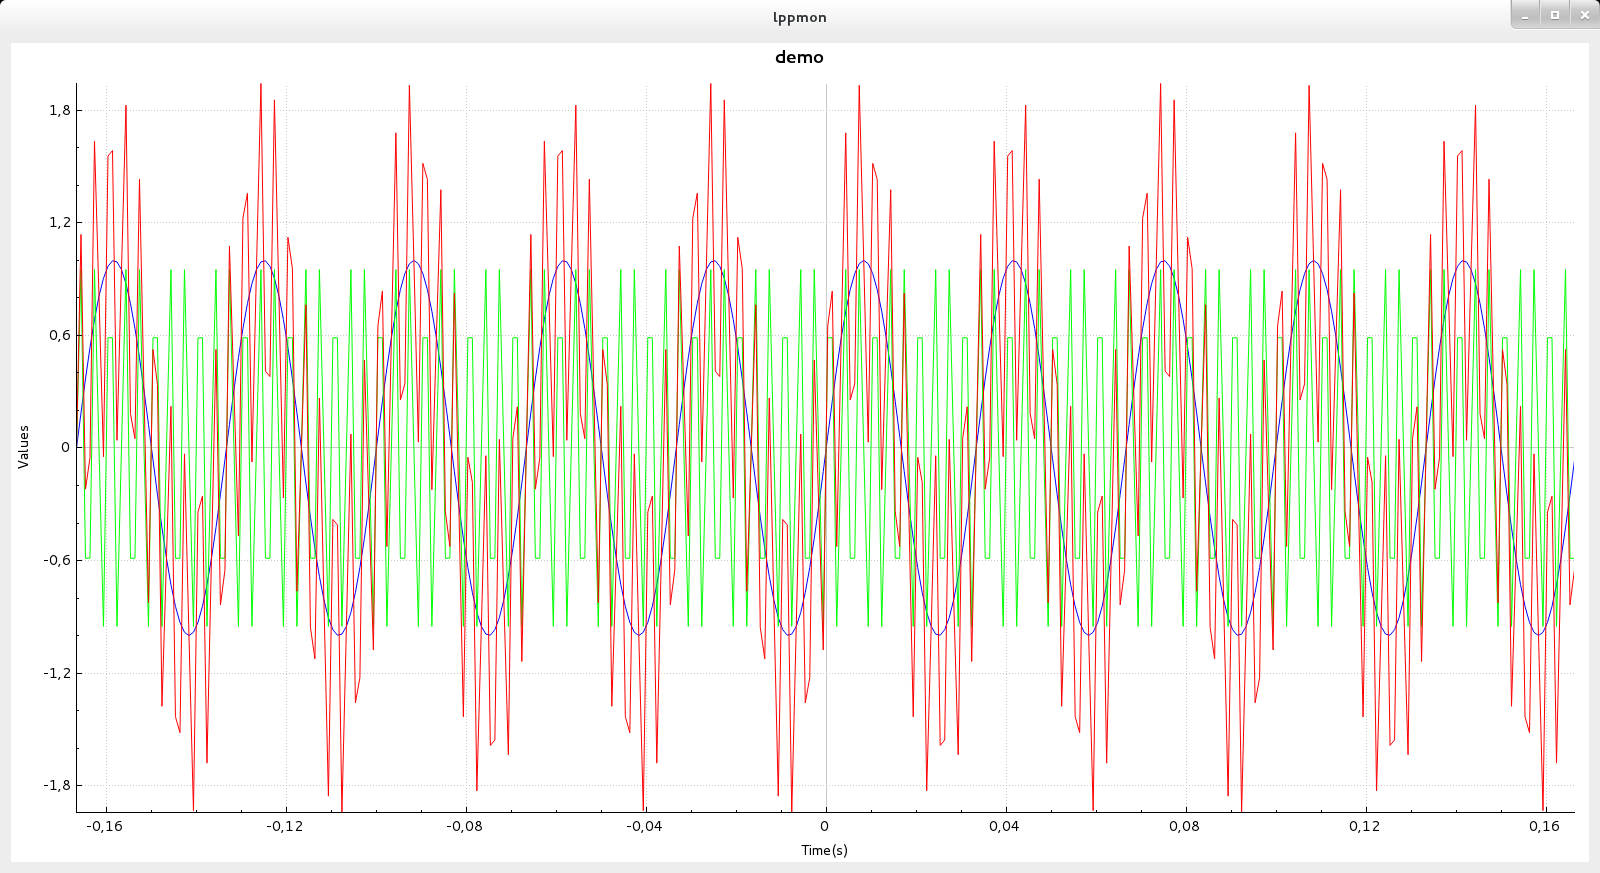
SocExplorerPlot is a wrapper to the QCustomPlot class, a simple and efficient plot widget. The following example should give you this result, please note that you will also need numpy library to run it.

import numpy as np
freq1 = 30
freq2 = 300
time_step = 0.001

t_ini = -50 * 1.0/(max(freq1,freq2))
t_fin = -1 * t_ini

time_vec = np.arange(t_ini, t_fin, time_step)

#input signal
input_sig1 = np.sin(2 * np.pi * freq1 * time_vec)
input_sig2 = np.sin(2 * np.pi * freq2 * time_vec)
input_sig = input_sig1 + input_sig2

plot=PySocExplorer.SocExplorerPlot()
plot.setTitle("demo")
plot.setXaxisLabel("Time(s)")
plot.setYaxisLabel("Values")

Courbe1=plot.addGraph()
Courbe2=plot.addGraph()
Courbe3=plot.addGraph()

plot.setGraphData(Courbe1,time_vec.tolist(),input_sig1.tolist())
plot.setGraphData(Courbe2,time_vec.tolist(),input_sig2.tolist())
plot.setGraphData(Courbe3,time_vec.tolist(),input_sig.tolist())

pen=plot.getGraphPen(1)
pen.setWidth(1)
color=pen.color()
color.setRgb(0x00FF00)
pen.setColor(color)
plot.setGraphPen(1,pen)

pen=plot.getGraphPen(0)
pen.setWidth(1)
color=pen.color()
color.setRgb(0xFF0000)
pen.setColor(color)
plot.setGraphPen(2,pen)

plot.rescaleAxis()
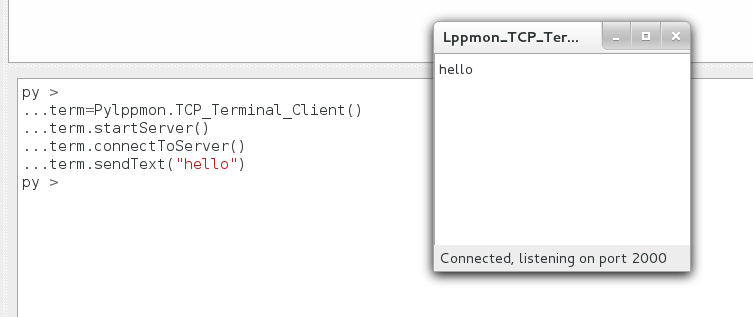
Sometime you need to print some information while your python script is running, unfortunately SocExplorer isn't multi-threaded so you won't get any output until your script execution is finished. To solve this problem with SocExplorer setup you will get a small tcp terminal program which will run in a separated process. From one Python object you will be able to start the terminal process and to send it some data to print. Note that an other utilization of this terminal should be to deport the print outputs on a distant computer.
term=PySocExplorer.TCP_Terminal_Client()
term.startServer()
term.connectToServer()
term.sendText("hello")
Should give you this result

term=PySocExplorer.TCP_Terminal_Client()
#for a distant connection you can specify the distant address and port
#remember to check your firewall setings
term.connectToServer("192.168.1.10",2000)
term.sendText("hello")
import time
terminal=PySocExplorer.TCP_Terminal_Client()
terminal.startServer()
terminal2=PySocExplorer.TCP_Terminal_Client()
terminal2.startServer(2200)
terminal2.connectToServer("127.0.0.1",2200)

terminal.connectToServer()
terminal.sendText("<p><b> "+str(time.ctime())+": </b></p>"+"Hello World")
terminal2.sendText("<p><b> "+str(time.ctime())+": </b></p>"+"Hello World on terminal 2")
terminal.sendText("<p><b> "+str(time.ctime())+": </b></p>")
terminal.sendText("<p><b> "+str(time.ctime())+": </b></p>"+"<ul>HTML Items List Example:<LI>Item1</LI><LI>Item2</LI></ul>")
terminal.sendText("<p><b> "+str(time.ctime())+": </b></p>"+"<p style=\"color:#0000ff\" style=\"background-color:#00ff00\">hello</p>")
for i in range(0,100):
  terminal.sendText("<p><b>"+str(time.ctime())+": </b></p>"+"<p style=\"color:#0000ff\" style=\"background-color:#00ff00\">hello "+str(i)+"</p>")
  time.sleep(0.05)
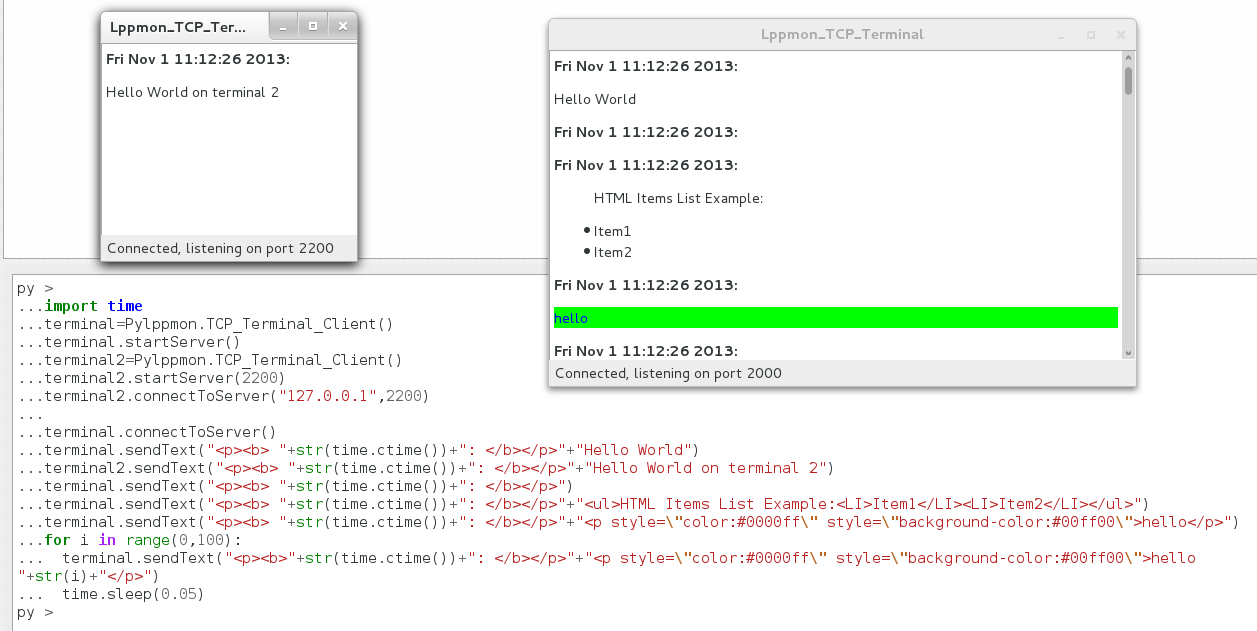
Should give you this result
